
It’s very common. I’ve been there. Relying on Excel reports that is emailed back and forth, often, these offline Excel based reports are prepared for decision makers like you, way too late.
Why not have a dashboard? You may be thinking, “dashboard is just too expensive to build and it’ll take too much time”. It is true building a dashboard used to take many months and it required six figure investment as it surely involved many developers and coders to customize everything to suit your needs.
This is no longer the case, with rapid adoption cloud computing, there are many self-service business intelligence (SSBI) tools out there. SSBI is becoming an industry of its own within the Big Data space. Many organization and businesses are embracing the adoption of SSBI and three companies/tools are leading the rapid adoption of SSBI - Microsoft Power BI, Tableau, and Qlik. These leaders in SSBI provides quick, cheap, and easy development and implementation of dashboards.
You may be thinking, I have a small business and dashboards are sort of reserved for large enterprises. If you’re thinking this way, you’re in for a very pleasant surprise. Dashboards are much easier to implement in small businesses than compared to large enterprises. Big businesses have much more complex and many databases/sources to combine and make data usable and they must build and maintain data warehouses. However, small businesses have much less data sources and have relatively less transactions in their datasets. In most cases, this allows small businesses to develop dashboards without having to build a data warehouse. This is a huge bonus for small businesses when they don’t have to spend a lot of money upfront building data warehouses.
Today’s SSBI tools allow small businesses ability to connect to multiple datasets and sources and ultimately have robust, interactive, and visually appealing dashboards. Most data sources we see in our small business clients are QuickBooks (financial system), combined with their operational tools, such as POS data, sales opportunity data (e.g. Salesforce), employee time logging system. When these datasets are combined, you have very powerful Key Performance Indicators (KPIs), such as Revenue per employee hour, Revenue per headcount, Average revenue by zip code, compared to average clicks in Google Analytics, etc. The KPIs will give you insights you never had before and with good dashboards, you’ll have this key information at your fingertips to make timely decisions.
SSBI is rapidly being adopted by many businesses today. You’ll have competitive advantage over your competitors by adopting and implementing dashboards today. However, in few years, it’ll quickly become competitive disadvantage if you don’t have it, because your competitors will have dashboards, helping themselves making well informed and timely key decisions to propel their businesses.
Dashboarding is like the Personal Computer (PC) and the Internet. In the 1980s, everyone had to have a personal computer. In the 1990s, with the adoption of the Internet, everyone had to have an email account without fully understanding why at first. Dashboard is like these two major events that you’ll have to adopt and embrace it to get your business ahead.
Aver Analytics specializes in use of Microsoft Power BI to help our small business clients to unearth key insights buried in their data. If your business between $2M and $30M in revenue, contact us today to inquire how we can help you.
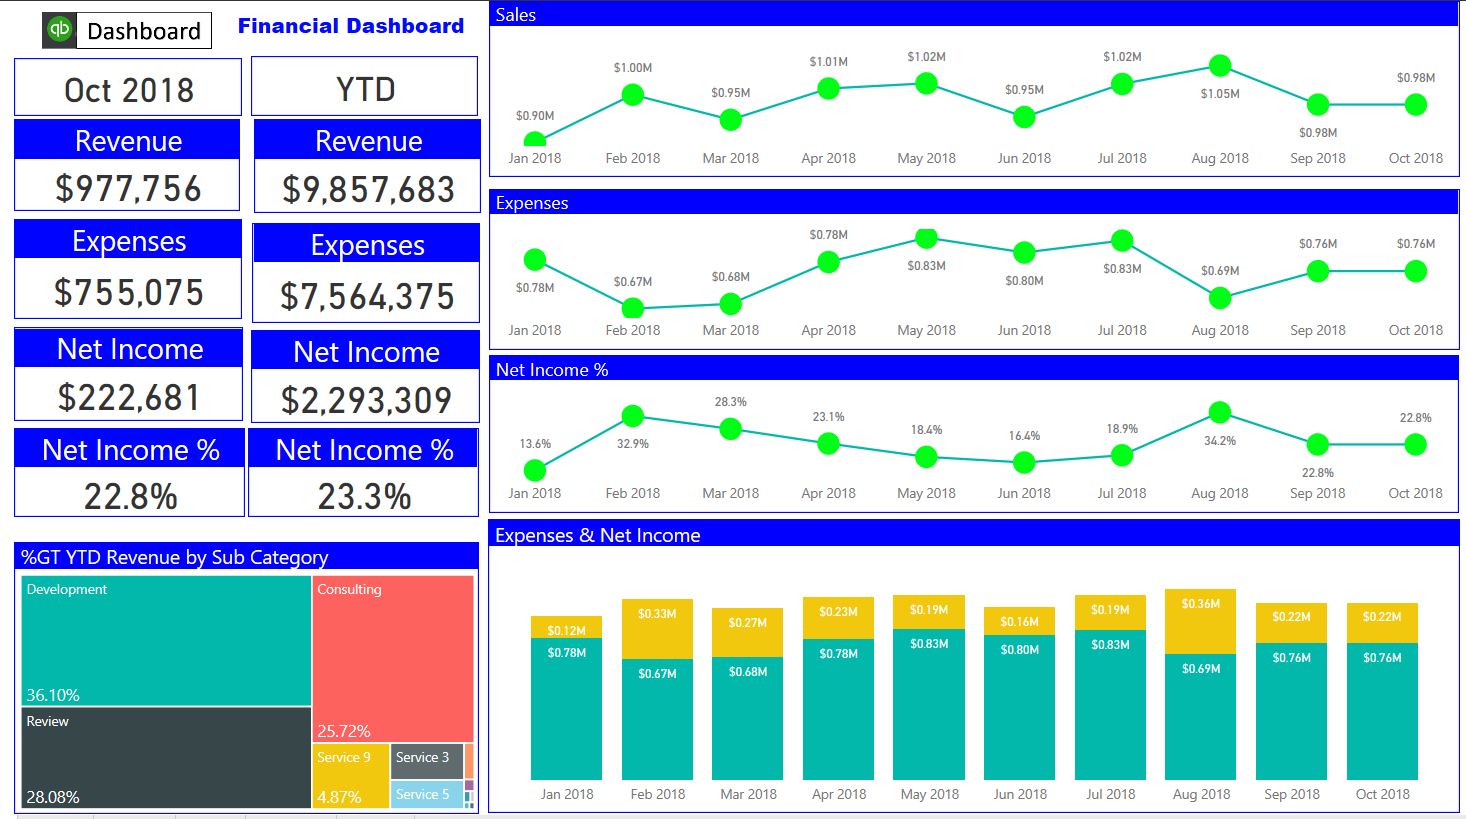
Go ahead and click the sample financial dashboard below. Click and see the visuals update before your eyes, instantly giving you different views and perspective.